Image

Traditional thinking says that an electronic trial master file application (eTMF) is simply a repository for storing documents related to a clinical study. But today, that’s only partly correct. A modern eTMF application provides so much more to the clinical operations teams. And one of these things is improved collaboration between the sponsor and CRO (contract research organization).
To understand the relationship between sponsor and CRO and how that relates to the eTMF, Agatha joined customer DZS Clinical Services for a webinar that provided insights into ensuring a strong relationship of collaboration and communication.
Here are some highlights from that webinar (and a link to the replay at the end).
Kari Brown, Senior Director of Clinical Services for DZS, shared her insights on the relationship between CRO and sponsor. She said that the best working relationship sees the CRO as an extension of the complete team, where opinions and expertise are respected, and mutual trust is built on clear upfront communication and expectations. Kari offered her five hallmarks of a great CRO-sponsor relationship:
When talking about collaboration, you need to talk about technology. The eTMF is only one type of technology required. The slide below shows some other technologies used.
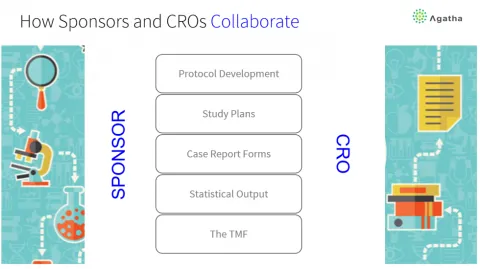
The sponsor owns and has ultimate responsibility for the TMF. But they don’t always use their own eTMF. Sometimes, the sponsor supplies the eTMF and has its IT team set up a study and provide access to the CRO. Other times, the sponsor wants the CRO to supply the eTMF application. In either case, it is a collaborative effort to manage the TMF.
Kari said that some sponsors delegate all the management of the TMF, but she argued that the sponsor still needs to have a role. For example, the sponsor can do overall quality control (QC) of the TMF. Essentially, said Kari, the sponsor must know their TMF, so having them involved is very important.
The eTMF is not just a document repository. It is expected to tell the story of the clinical trial, and that is becoming increasingly important because the FDA auditors are more and more requesting access to the eTMF to perform their audits. Sometimes, said Kari, they aren’t even speaking to the sponsor or the CRO involved.
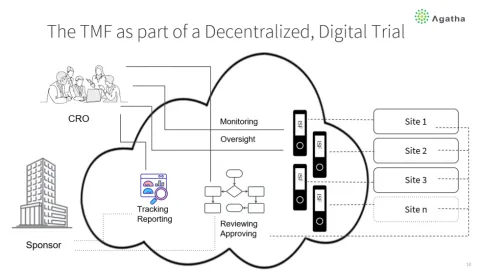
Ken said that the eTMF is often at the center of conversations, activities, and processes between the sponsor, CRO, Sites, and regulatory agencies. When it’s at the center, it’s not only about managing documents but also about communications and collaboration.
You can also extend it to the Site side to monitor and perform quality processes on the investigator site file (ISF). For example, a CRA can look at essential documents within the ISF and transition them to the TMF as they are reviewed and approved. Or the CRA can add comments and feedback on a document to get the Site to make modifications.
According to Kari, the eTMF is a powerful tool for collaboration:
The eTMF acts like a Hub for the digital decentralized trial process. If that’s true, then what does the eTMF need to have for features and capabilities?
There is a basic set of features that most eTMF vendor provide. But in addition to basic features, other critical capabilities make it the hub for the management of the TMF:
“This isn’t just a space to drag and drop things in a folder. This is a system to manage relationships and interactions and support the trusted environment so that there are fewer dropped balls and there are less of those human errors that you were talking about, Kari. In my view, this goes a long way towards improved quality, as well, when we have a system that captures all [the majority] of the interactions.”
Ken Lownie, Head of North American Operations, Agatha
Watch the full replay to hear Kari’s stories working in a CRO with multiple sponsors and learn more about eTMF applications. You can also download the whitepaper: Beyond Storage: How CROs and Sponsors Work Together to Manage the Complexities of eTMF Oversight.
For inquiries about our products and services, or to sign up for a demo, click here.